Dashboards Module
The Dashboards module allows you to visualize and monitor your IoT data in real-time through customizable and interactive dashboards.
With a powerful drag-and-drop interface, you can easily design dashboards tailored to your operational needs — whether you're tracking energy consumption, parking availability, environmental readings, or traffic conditions.
Dashboards display your most important KPIs, metrics, alerts, and device statuses in one place, enabling faster decision-making and better situational awareness across your smart infrastructure.
Data Visualization
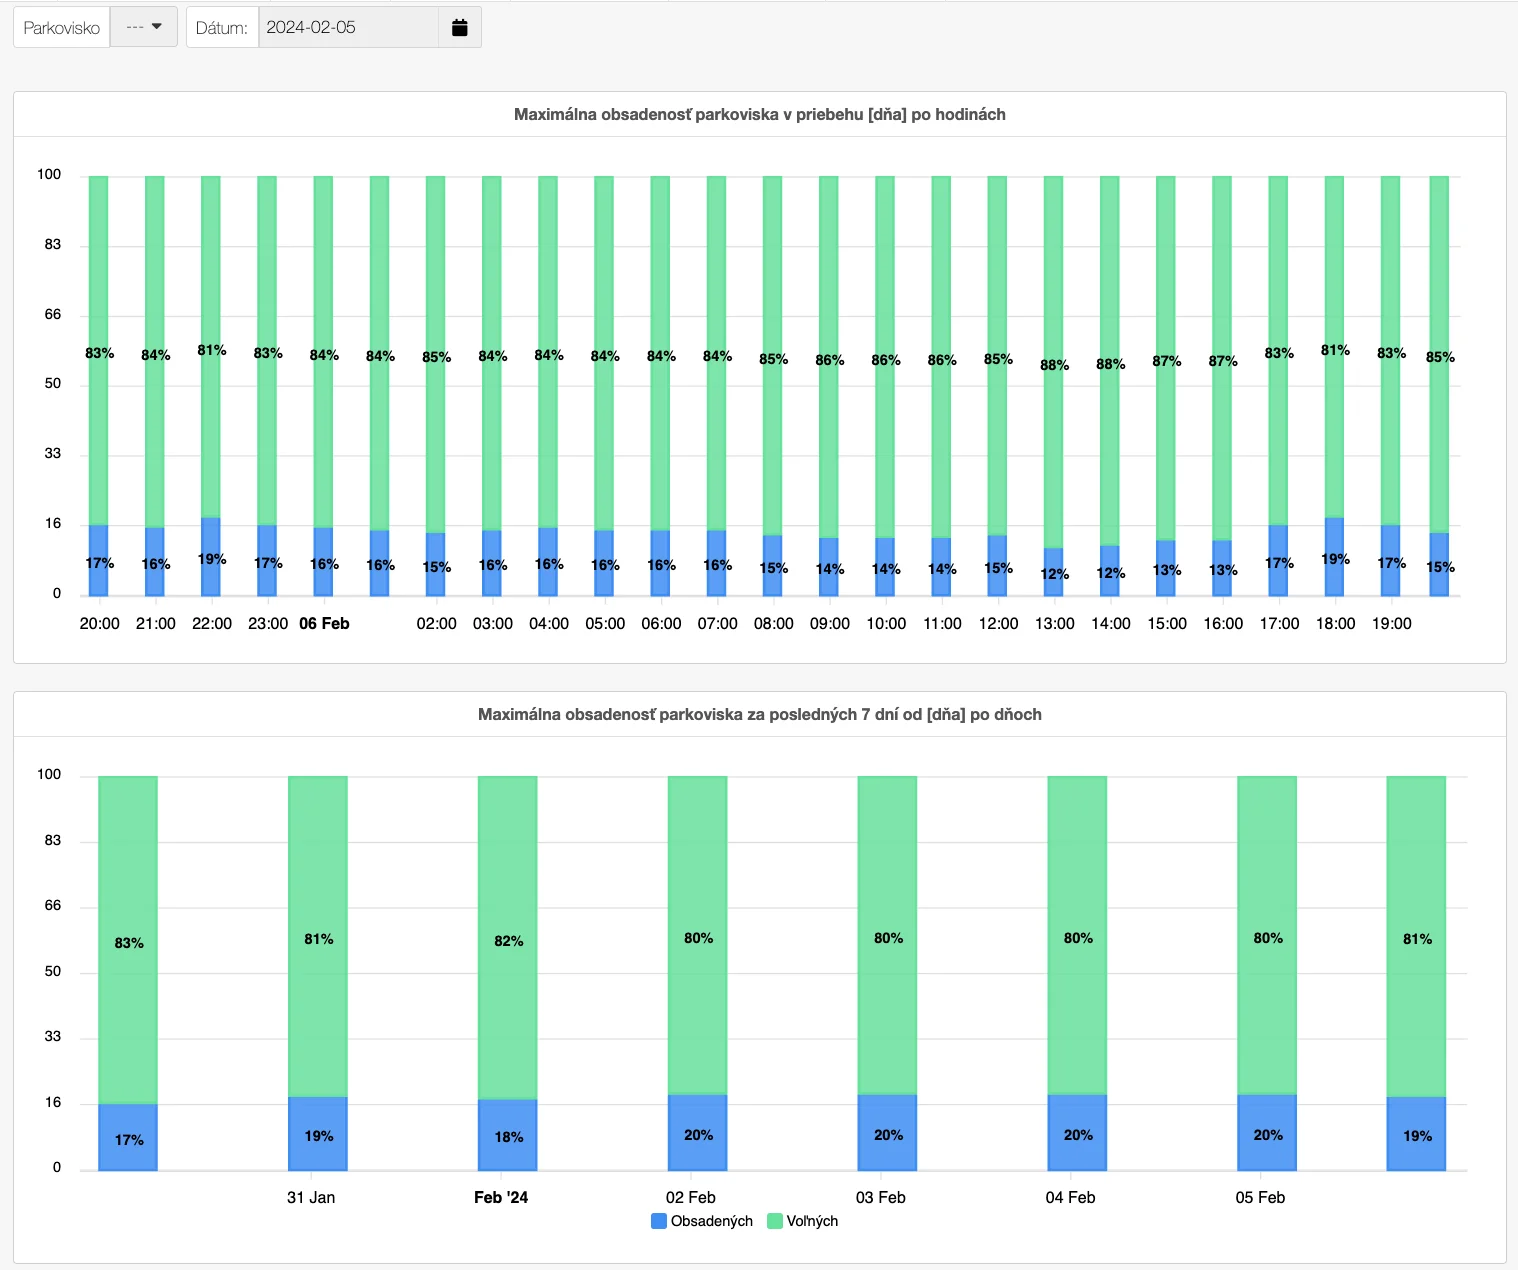
Display collected data in the form of interactive charts, graphs, maps, and tables — making complex datasets easier to interpret. The module supports geo-spatial visualizations, KPI panels, scorecards, trend lines, and other data widgets essential for operational clarity.
Real-Time Monitoring
Dashboards are continuously updated with live IoT data. Alarms and warnings appear instantly, allowing teams to react quickly to anomalies, system events, or threshold violations.
Customizable Design & Layouts
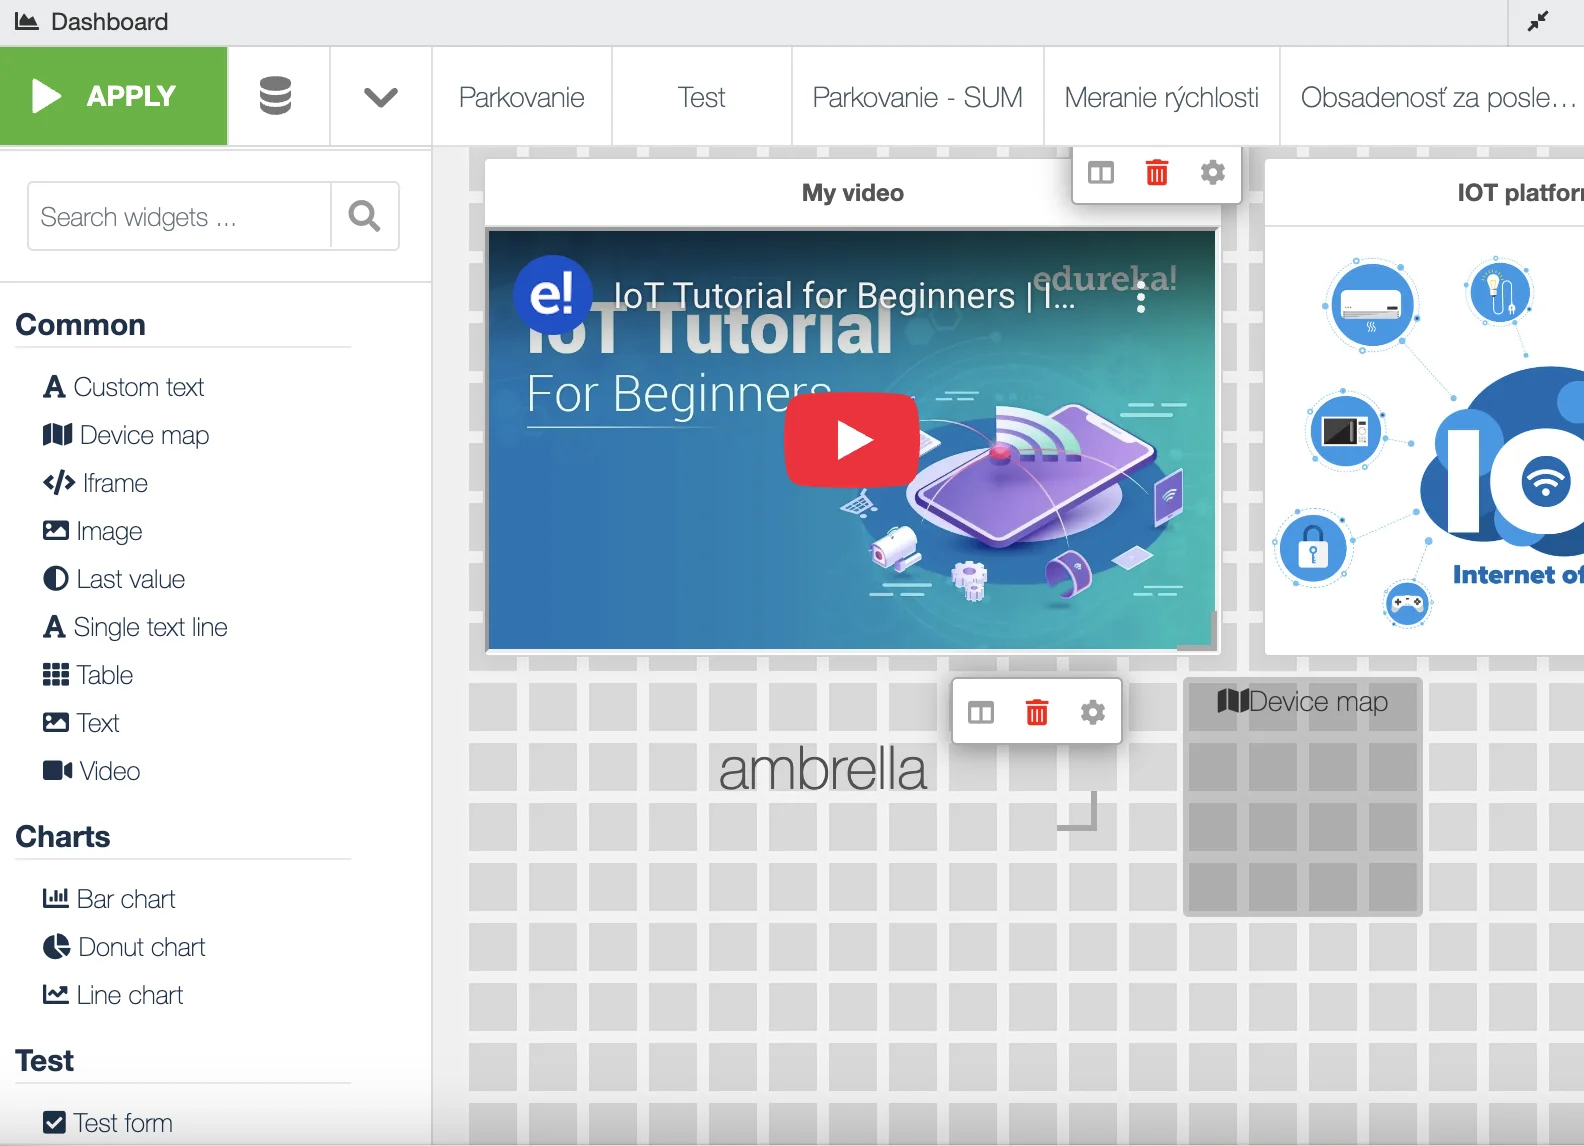
Use a drag-and-drop editor to create dashboards with the layout and widgets you need. Users can define the structure and content of each dashboard to match specific operational roles or use cases.
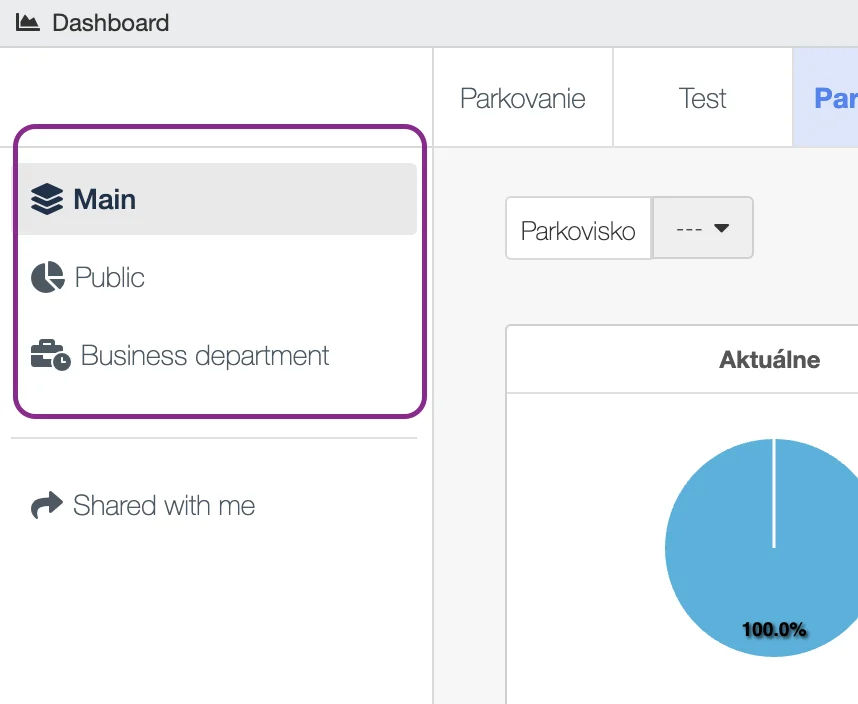
Grouped Dashboards with Role-Based Sharing
Create multiple dashboards for various teams, devices, or domains, and organize them into logical groups for easier navigation. Each dashboard or group can then be shared with selected users or roles, ensuring secure and targeted access to relevant data.
Support for Embedded Content
Embed third-party applications or visual elements into dashboards via HTML content or iFrames, extending the dashboard's capabilities beyond native widgets.
Geospatial Data Integration
Integrate and visualize data from various GIS sources (e.g., ESRI, Mapbox, OpenStreetMap) and support formats such as WMS, KML, SHP, and CityGML — ideal for city infrastructure monitoring and planning.
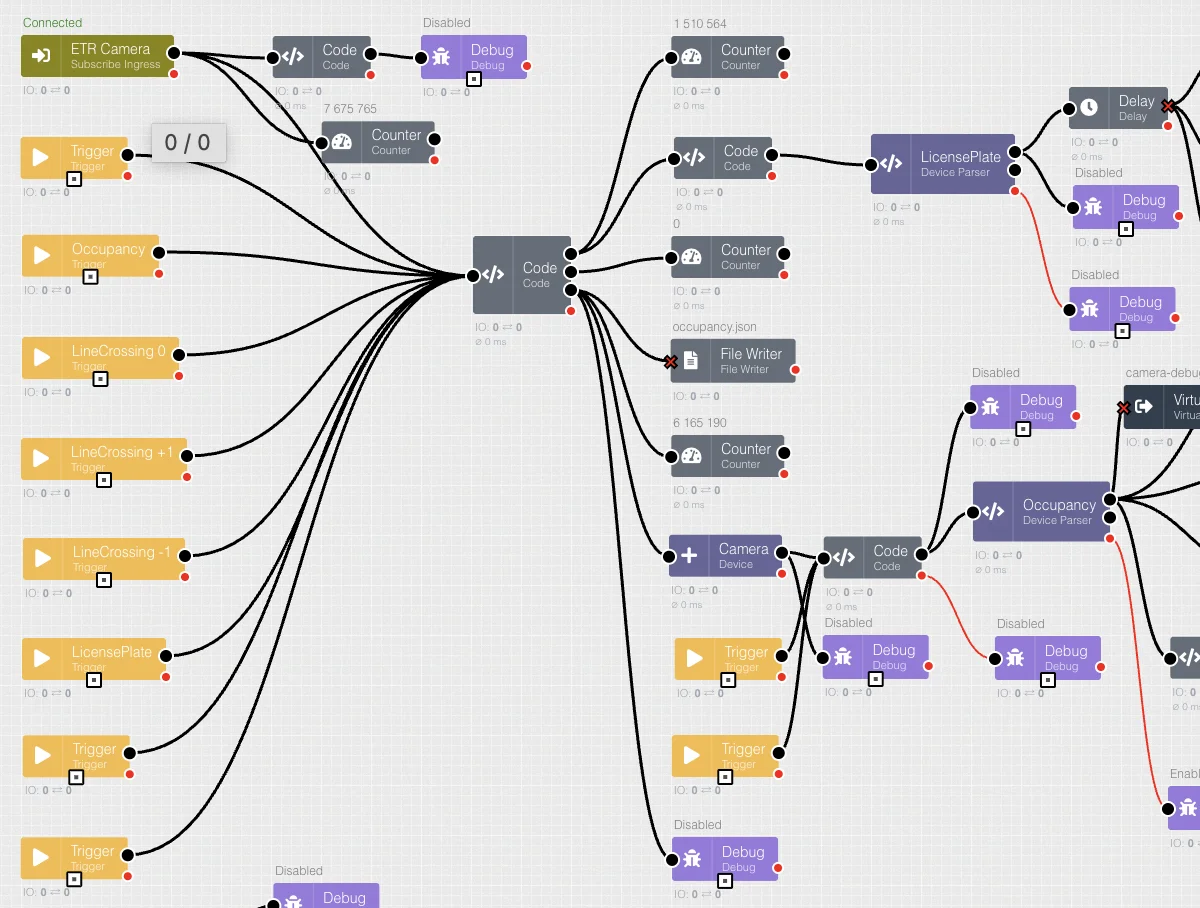
Data Preparation for Visualization
The system enables users to prepare datasets for dashboard use by filtering, aggregating, or segmenting data by time, region, or other dimensions.
Public & Shared Dashboards
Dashboards can be made publicly available or embedded on external websites, supporting transparency initiatives or citizen-oriented data displays.